Part 1
How many African American consumers in your neighborhood?
There is an online map service that displays population by race and income level per small block. The internet address is http://www.justicemap.org. This website is based on the data including 2016 population estimates by the US Census Bureau. If you set the map to show black population, you can see on the map that African meri-can population is dense in the East and Southeast region. If you look at the recent trend of African American population, California in the West is losing African American population while the East and the Southeast are gaining.
With a few mouse clicks, you can learn African American population and income level of the area around your store
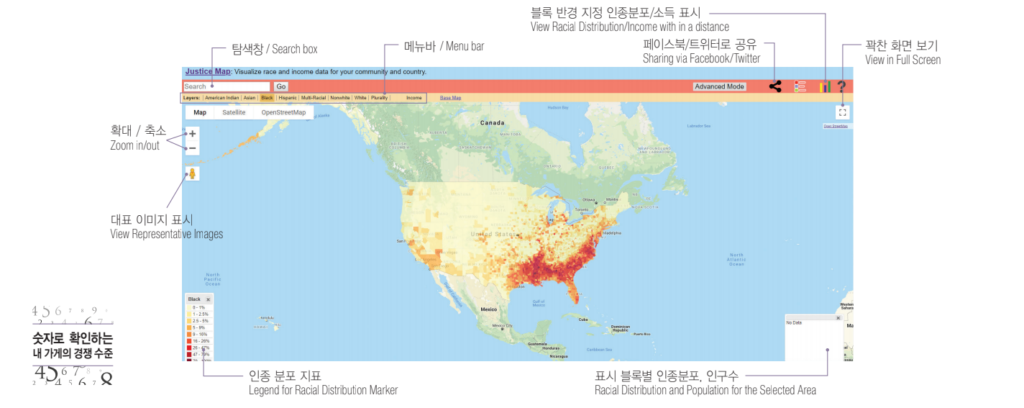
A search box is located on the top left corner of the page. Right under the search box, a menu bar lists race options on the left side and income levels on the right side. Right under the menu bar, “Map”, “Satellite”, and “Open Street Map” buttons are located. Underneath them, “+” and “-” buttons that is used to zoom in and out on the map. If you drag an icon that looks like a human figure to a certain point of the map, you can see the representative images of the location. For example, if you drop the human figure on Nevada, an image of Hoover Dam would appear. This functionality can be exploited even when the map is displaying data by block. On the right side of the bar with a search box, there are buttons for sharing, displaying legends, and analysis. The sharing button can be used to post the data on Facebook and Twitter. Under the menu bar, there is a dotted square icon for a full screen view. On the left bottom, there is a legend for population distribution markers. One in the right bottom shows the data for the area you selected. Before you select any specific region, the right bottom box will display no data.
You can research racial distribution by block
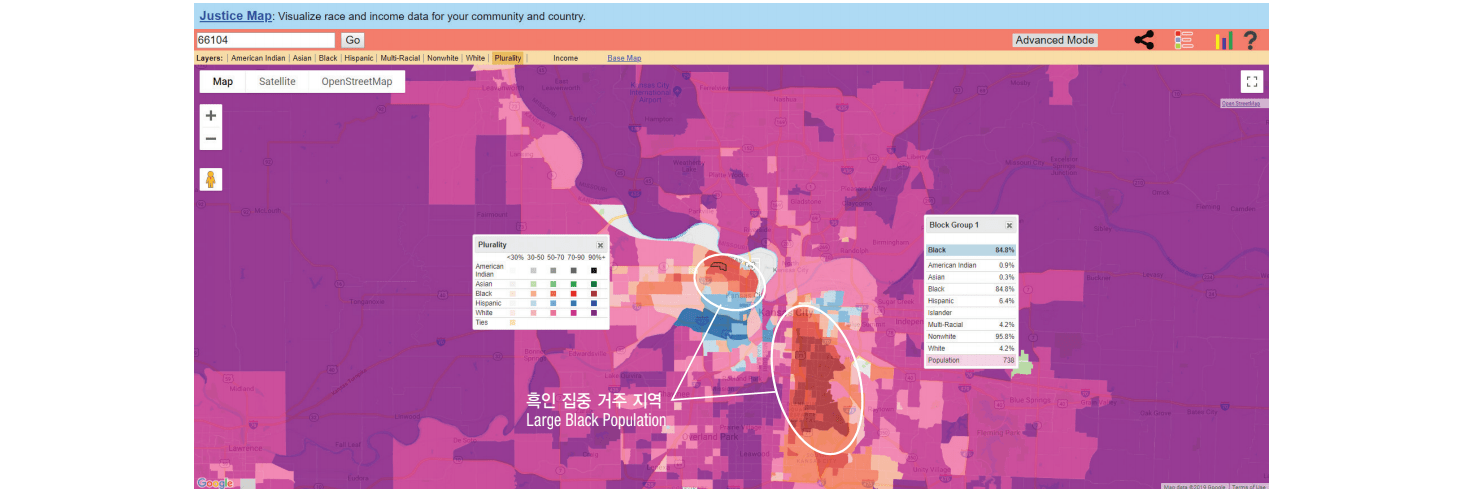
Multiple blocks are covered by the ZIP code OOOO4. If you focus on the color of each block, you will see there are two blocks that have large Black population compared to other areas made up with largely White population. You can display the demographic data for each block by clicking a block you wish to investigate. The block we selected had 738 residents among which 84.8% is Black and 95.8% is non-White including Hispanic.
Demographic and income data for neighboring blocks
You can also find out the racial distributions and income levels of neighboring area by using the analysis button, which looks like a graph, and enter a distance by which you want to expand your search. The data includes your selected block and blocks within the distance you entered.
You can zoom in to figure out the information for smaller blocks
As you zoom in to the map, the block size becomes smaller. Let’s try to pinpoint a smaller region by zooming in and selecting a smaller block displayed. Within the previously selected block, there is a small block with population of 100 and average income of $31,548. If you expand the search to 0.5 mile distance, you will see the population increases to 1,642 with no income data. In a mile radius, the popula-tion is 6,224 with income per capita of $29,448.
Part 2
Where Are Beauty Supplies Located?
The search results previously discussed can be combined with dif-ferent data sets from other websites, so you can more accurately understand the beauty supply retail market competition in the region. Beauty supplies are usually located within African American commu-nity because of the products they usually carry. Let’s study what is the usual statistical characteristics for regions, including small, mid-size, and large cities, on which beauty supply stores rely.
We will apply a 2-mile radius to a location of a beauty supply store
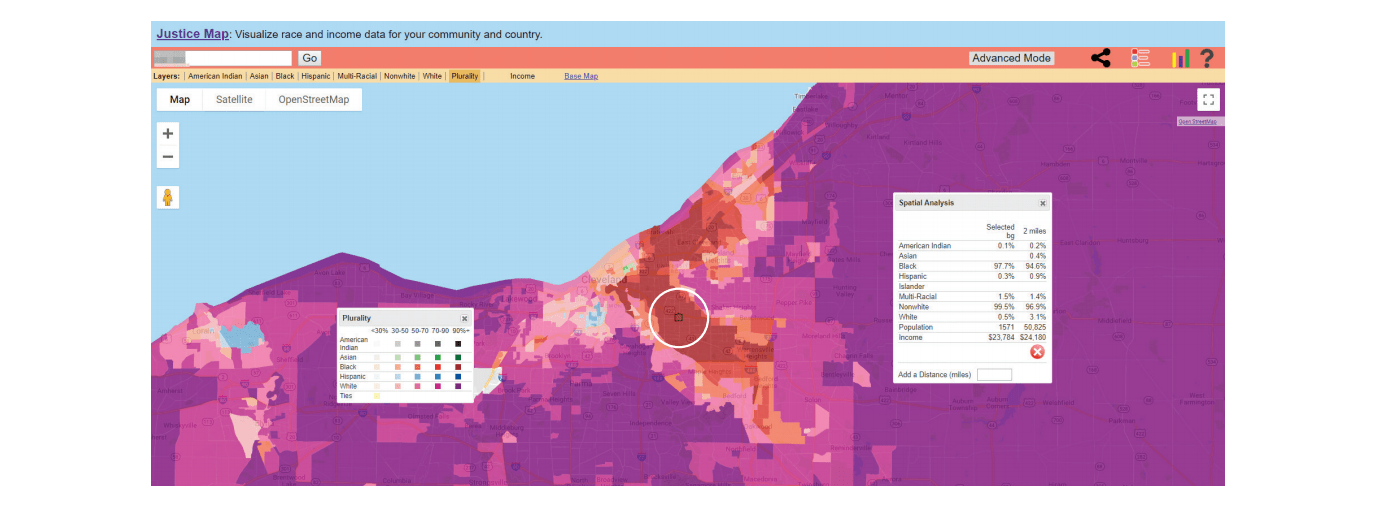
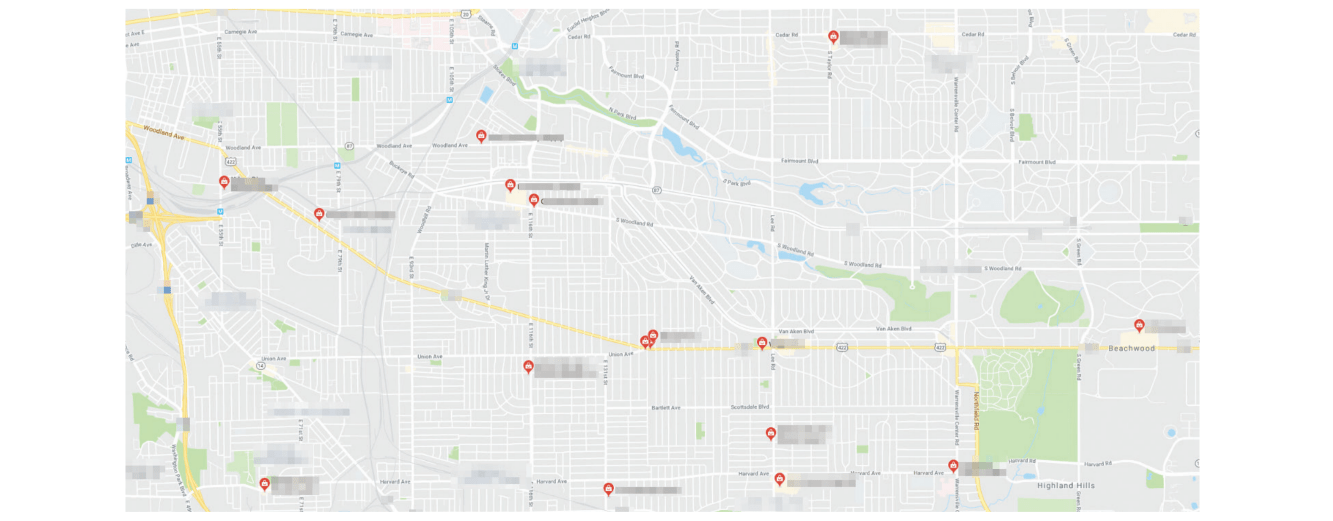
For the searches, we needed to collect various data. First, we looked up African American population by ZIP code using http://zipatlas.com/us/zip-code-comparison/percentage-black-population.htm. For example, let’s find out the racial distribution and income level of a randomly selected ZIP code OOOO0 with 76.29% African Ameri-can population. You type OOOO0 in the search box and click “Go” to display the below map. Now, you select the part of the map with a darkest color that shows higher density of Black population and set the distance of two miles for analysis. The reason we limited the search with a two-mile distance is that any distance longer than that would widen the search area so much as to include unrelated communities nearby, rendering the income data inaccurate. Also, you can generally consider 4-5 miles radius as a market for a retail store. In other words, you can consider any two retail stores within a 4-5 miles distance as competing stores. To add, if you Google “beauty supply store” on a map, the search results will show generally 6-7 miles radius for a given densely populated area. Although the search does not show a region based on a ZIP code, it presumably displays a region considered a single market.
Marked with a white circle is the 2-mile radius from the selected block, for which a total population of 50,825 is recorded with 94.6% Black or 48,080 in numbers. The average income is $24,180. Here you should pay our attention to the income data. This website pro-vides racial distribution data but no income by race data. The above value reflects an income computed based on the total population of the area. If Black population makes up the most of the popula-tion in the area, the general income data will be relatively accurately reflecting income levels of African Americans, but otherwise, other races including Hispanic, White, and Asian populations would shift the income level too much. Accordingly, you want to disregard any general income data for a region with lower than 65% African Ameri-can population.
The West has no region that has more than 65% African American population
Accordingly, we did not include the Western region in this analysis. This analysis is for regions comprising the East, the Southeast, and the Southwest. Also, we only included regions that have more than 65% Black and about 20% Hispanic, which would result in more than 85% non-White population. We presumed that if White population is over 15%, the margin of error for income data were too high. If we can collect regional income data by race, we can further analyze areas with 20% to 30% African American population.
The relationship between beauty supply and income level
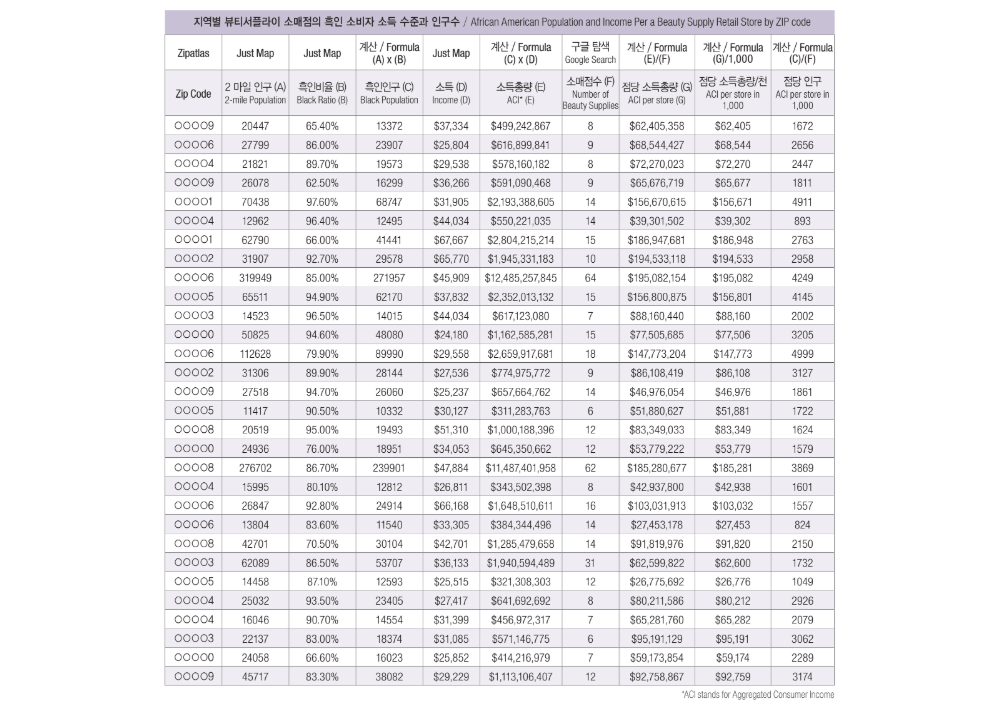
The revenues of beauty supply retail stores are largely dependent upon African American population and income. This income includes not only earned income but government subsidies. The total income can be calculated from multiplying the African American population and average individual income. For example, we will compute total income of area with ZIP code OOOO9. Within 2-mile radius from the selected block after a ZIP code search, the African American population was 13,372 and income per capita was $37,334. So, if you multiply the two numbers, you can estimate $499,242,867 as the Aggregated Consumer Income of African Americans in the region. [13,372 X $37,334 = $499,242,867] We excluded any non-residents for calculating the AGGREGATED CONSUMER INCOME and African American population. If you located eight beauty supplies in a Google search for the re-gion, then you can average the aggregated consumer income of $62,405,358 per store. This means the potential consumers in the region have that much annual income before taxes, part of which will be spent in beauty supplies. Next factor we want to consider is the number of potential consumers per store. Although females are the usual clients of beauty supplies, here you compute 1,672 people per store by simply dividing total African American population of 13,372 by eight stores. As such, you can conclude a beauty supply in ZIP code OOOO9 runs on 1,672 African American population per store and $62,405,358 aggregated consumer income per store. Using the above illustrated method, we analyzed 30 areas of which African American population was over 65%.
Smaller cities may have heated competition
We put the data into a frequency graph for an easier view. Per the graph, you can learn what statistics is required for running of a beauty supply retail store. In the graph, “A”, shown top right, stands for a group of beauty sup-plies located in big cities like NYC and Chicago. The group has higher aggregated consumer income per store as well as more population per store than other groups. This can reflect the fact that the higher rents and expensive wages of a big city demand a lot larger customer base. On the other hand, despite the heavy competition due to a larger num-ber of beauty supply retail stores in a given area, the retail stores can survive relying on the high income and population in the area. Bottom left, you see the group “B” which consists of the most com-petitive areas or small cities with low income and population. Accord-ing to the above table, the area with ZIP code OOOO4 has African American population of 12,495 and average income of $44,034 which are relatively high, but there were fourteen beauty supplies. As a result, they presumably had the weakest customer base per store. On the other hand, ZIP code OOOO5 represents a community with low African American population as well as low income. In such market, you can probably still run a beauty supply with appropriate business strategies including pricing. For example, a store within a region with a low income and population would expect less customer traffic, so it should consider carrying low-priced products but selling at no discount. In our opinion, you definitely want to avoid these areas if you are opening a new beauty supply retail store. In most mid-size cities, a beauty supply had 2,000 to 3,000 popula-tion per store and $50,000,000 to $100,000,000 aggregated con-sumer income per store. For these regions, the location of a retail place will determine the fate. Nevertheless, as these regions have relatively lower rents than bigger cities, you want to find a Beta zone that has a relatively large consumer base. In fact, these areas within the Beta zone have relatively high income and less competition. Like your cell phones become smarter, it’s a time for you to smart up your business location and strategy for your retail stores.