Fifty Years of Change in U.S. Households:
From Families to Individuals
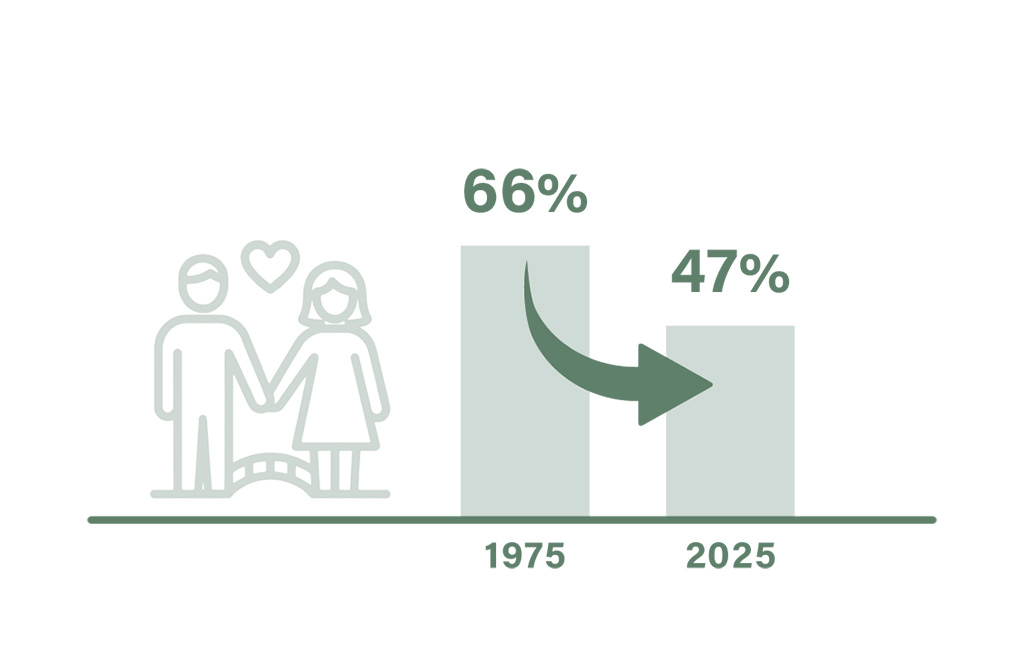
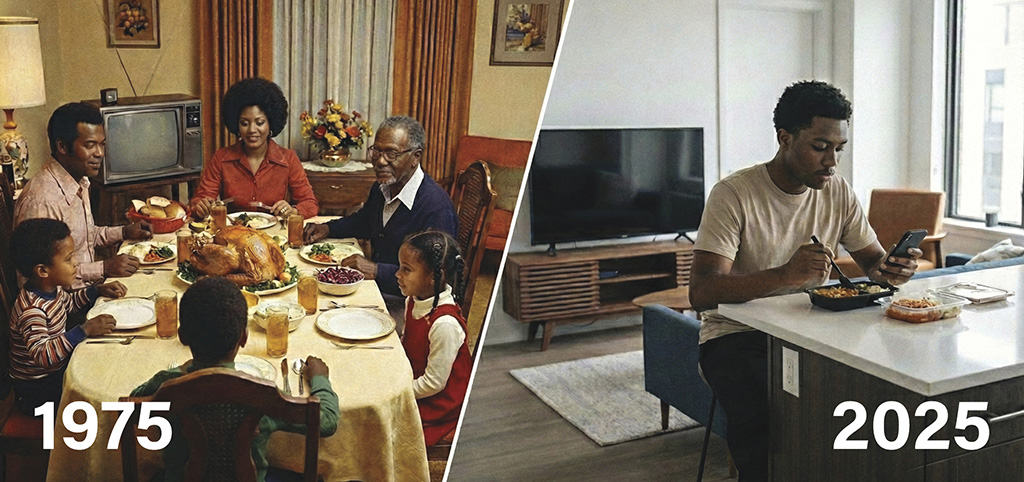
The U.S. Census Bureau released its 2025 statistics on families and households, offering a numerical look at how the composition of American homes has changed over the past 50 years compared with 1975. While households made up of “a married couple with children” were once the most common, today the landscape is far more diverse, with one-person and two-person households taking a larger share. These shifts reflect changing attitudes toward marriage and childbirth, as well as new ways of working and living. As the most basic unit of society evolves, it also points to new lifestyles we will increasingly need to adapt to.
[ How Has the U.S. Family Structure Changed? A Look at the Numbers ]
[ What Additional Insights Can Be Drawn from the Data? ]
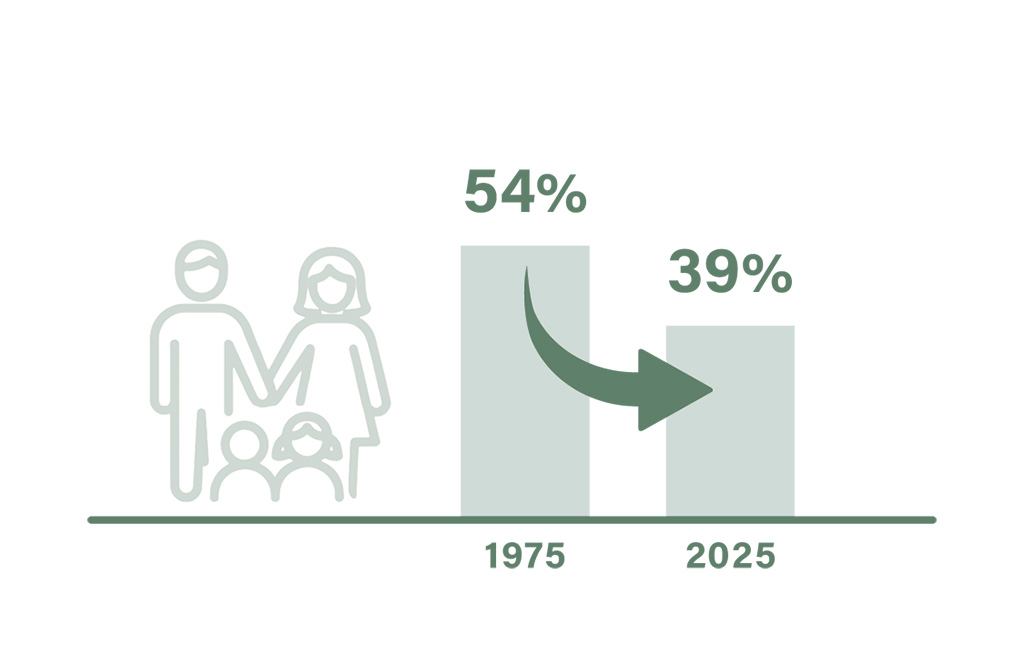
1) Married-couple households 47% / Households with children 39%
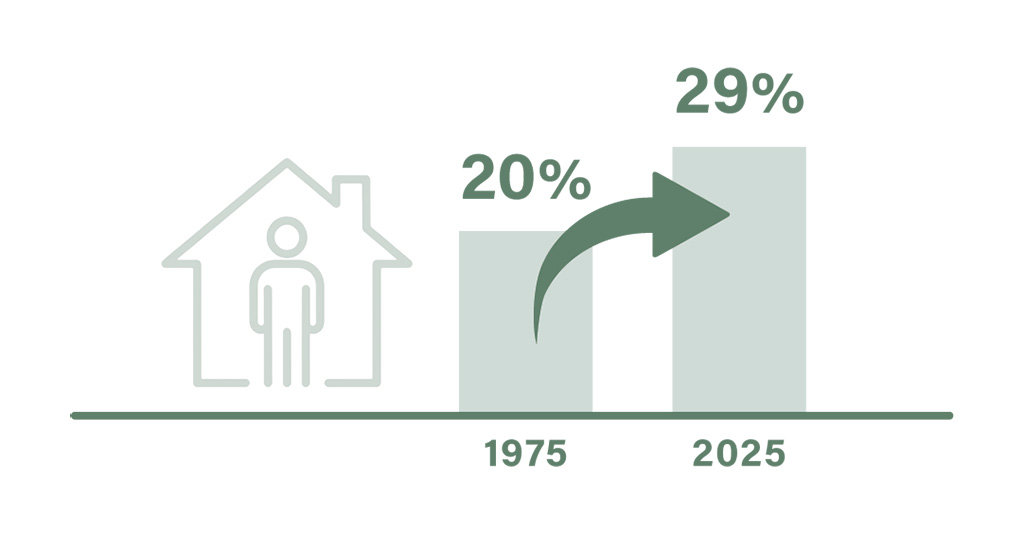
It is more practical to define the core customer not as “a couple with children,” but as an individual.
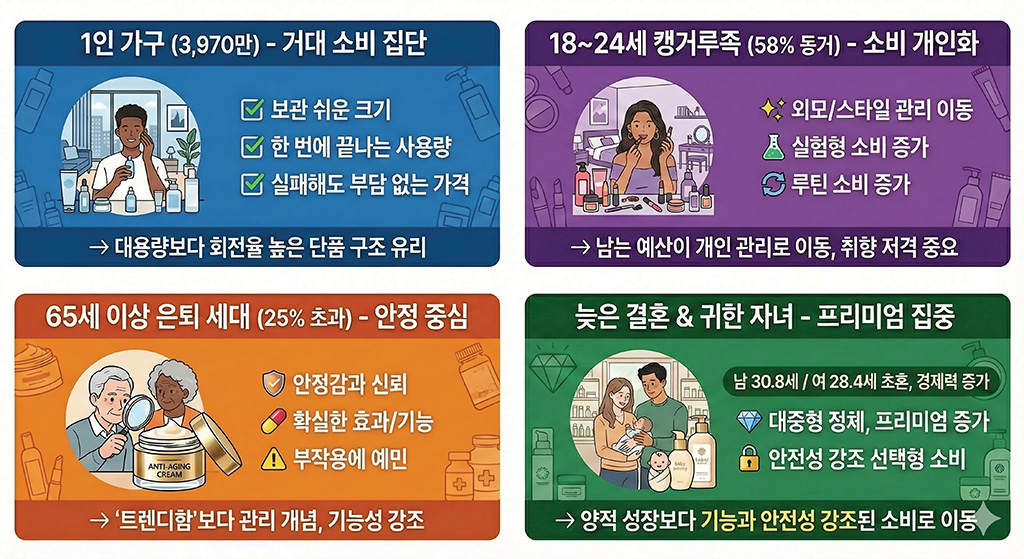
2) 39.7 million single-person households
They have become one of the largest consumer groups, with clear purchasing criteria.
◻ Easy-to-store sizes
◻ Single-use or one-time quantities
◻ Prices that feel low-risk even if the purchase fails
-> Rather than large-volume products, fast-turnover single items are more advantageous.
3) Householders aged 65 and over exceed 25%
One in four households is led by the retirement-age generation. Key characteristics include:
◻ High sensitivity to changes in appearance
◻ Strong focus on functionality
◻ Heightened concern about side effects
-> Stability, effectiveness, and ease of management matter more than trendiness.
4) 58% of those aged 18–24 live with parents
Independence may be delayed, but purchasing power has not disappeared. With lower housing and food costs, remaining budgets shift toward appearance, style, and personal care, making consumption more individualized.
◻ Increase in experimental purchases
◻ Growth in small-scale purchases
◻ Expansion of routine-based consumption
5) Rising median age at first marriage
Men 30.8 / Women 28.4, with households with children at 39%. As the number of children per household declines and parents are older, overall economic capacity has increased.
◻ Stagnation in mass-market products
◻ Growth in premium and specialized functional products
-> Rather than expansion of the baby and kids market, consumption is moving toward selective purchases that emphasize functionality and safety.